Analyzing workflow performance
The crunchstat-summary tool can be used to analyze workflow and container performance. It can be installed from packages (apt install python3-crunchstat-summary or yum install rh-python36-python-crunchstat-summary). crunchstat-summary analyzes the crunchstat lines from the logs of a container or workflow and generates a report in text or html format.
Syntax
The crunchstat-summary tool has a number of command line arguments:
~$ crunchstat-summary -h
usage: crunchstat-summary [-h]
                          [--job UUID | --container UUID | --pipeline-instance UUID | --log-file LOG_FILE]
                          [--skip-child-jobs] [--format {html,text}]
                          [--threads THREADS] [--verbose]

Summarize resource usage of an Arvados Crunch job

optional arguments:
  -h, --help            show this help message and exit
  --job UUID, --container-request UUID
                        Look up the specified job or container request and
                        read its log data from Keep (or from the Arvados event
                        log, if the job is still running)
  --container UUID      [Deprecated] Look up the specified container find its
                        container request and read its log data from Keep (or
                        from the Arvados event log, if the job is still
                        running)
  --pipeline-instance UUID
                        [Deprecated] Summarize each component of the given
                        pipeline instance (historical pre-1.4)
  --log-file LOG_FILE   Read log data from a regular file
  --skip-child-jobs     Do not include stats from child jobs/containers
  --format {html,text}  Report format
  --threads THREADS     Maximum worker threads to run
  --verbose, -v         Log more information (once for progress, twice for
                        debug)
Examples
crunchstat-summary prints to stdout. The html report, in particular, should be redirected to a file and then loaded in a browser.
An example text report for a single workflow step:
~$ crunchstat-summary --container-request pirca-xvhdp-rs0ef250emtmbj8 --format text
category  metric  task_max  task_max_rate job_total
blkio:0:0 read  63067755822 53687091.20 63067755822
blkio:0:0 write 64484253320 16376234.80 64484253320
cpu cpus  16  - -
cpu sys 2147.29 0.60  2147.29
cpu user  549046.22 15.99 549046.22
cpu user+sys  551193.51 16.00 551193.51
fuseop:create count 1 0.10  1
fuseop:create time  0.01  0.00  0.01
fuseop:destroy  count 0 0 0
fuseop:destroy  time  0 0 0.00
fuseop:flush  count 12  0.70  12
fuseop:flush  time  0.00  0.00  0.00
fuseop:forget count 0 0 0
fuseop:forget time  0 0 0.00
fuseop:getattr  count 40  2.70  40
fuseop:getattr  time  0.00  0.00  0.00
fuseop:lookup count 36  2.90  36
fuseop:lookup time  0.67  0.07  0.67
fuseop:mkdir  count 0 0 0
fuseop:mkdir  time  0 0 0.00
fuseop:on_event count 0 0 0
fuseop:on_event time  0 0 0.00
fuseop:open count 9 0.30  9
fuseop:open time  0.00  0.00  0.00
fuseop:opendir  count 0 0 0
fuseop:opendir  time  0 0 0.00
fuseop:read count 481185  409.60  481185
fuseop:read time  370.11  2.14  370.11
fuseop:readdir  count 0 0 0
fuseop:readdir  time  0 0 0.00
fuseop:release  count 7 0.30  7
fuseop:release  time  0.00  0.00  0.00
fuseop:rename count 0 0 0
fuseop:rename time  0 0 0.00
fuseop:rmdir  count 0 0 0
fuseop:rmdir  time  0 0 0.00
fuseop:setattr  count 0 0 0
fuseop:setattr  time  0 0 0.00
fuseop:statfs count 0 0 0
fuseop:statfs time  0 0 0.00
fuseop:unlink count 0 0 0
fuseop:unlink time  0 0 0.00
fuseop:write  count 5414406 1123.00 5414406
fuseop:write  time  475.04  0.11  475.04
fuseops read  481185  409.60  481185
fuseops write 5414406 1123.00 5414406
keepcache hit 961402  819.20  961402
keepcache miss  946 0.90  946
keepcalls get 962348  820.00  962348
keepcalls put 961 0.30  961
mem cache 22748987392 - -
mem pgmajfault  0 - 0
mem rss 27185491968 - -
net:docker0 rx  0 - 0
net:docker0 tx  0 - 0
net:docker0 tx+rx 0 - 0
net:ens5  rx  1100398604  - 1100398604
net:ens5  tx  1445464 - 1445464
net:ens5  tx+rx 1101844068  - 1101844068
net:keep0 rx  63086467386 53687091.20 63086467386
net:keep0 tx  64482237590 20131128.60 64482237590
net:keep0 tx+rx 127568704976  53687091.20 127568704976
statfs  available 398721179648  - 398721179648
statfs  total 400289181696  - 400289181696
statfs  used  1568198656  0 1568002048
time  elapsed 34820 - 34820
# Number of tasks: 1
# Max CPU time spent by a single task: 551193.51s
# Max CPU usage in a single interval: 1599.52%
# Overall CPU usage: 1582.98%
# Max memory used by a single task: 27.19GB
# Max network traffic in a single task: 127.57GB
# Max network speed in a single interval: 53.69MB/s
# Keep cache miss rate 0.10%
# Keep cache utilization 99.97%
# Temp disk utilization 0.39%
#!! bwamem-samtools-view max RSS was 25927 MiB -- try reducing runtime_constraints to "ram":27541477785
#!! bwamem-samtools-view max temp disk utilization was 0% of 381746 MiB -- consider reducing "tmpdirMin" and/or "outdirMin"
When crunchstat-summary is given a container or container request uuid for a toplevel workflow runner container, it will generate a report for the whole workflow. If the workflow is big, it can take a long time to generate the report.
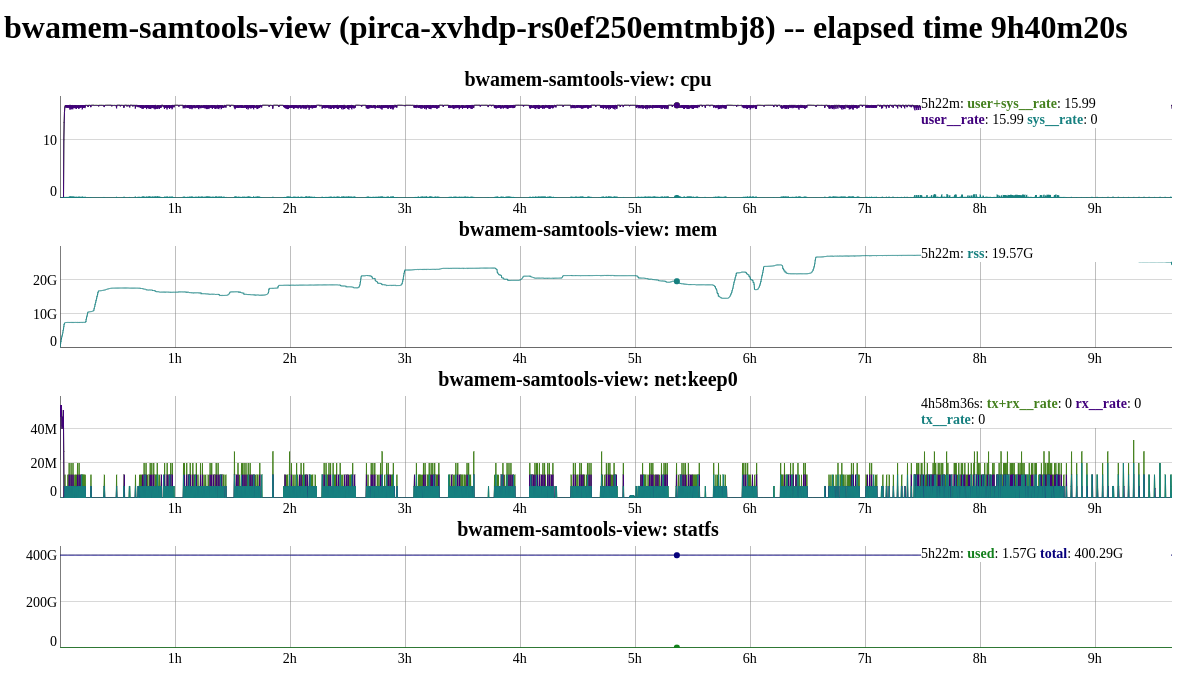
The equivalent html report can be generated as follows:
~$ crunchstat-summary --container-request pirca-xvhdp-rs0ef250emtmbj8 --format html > report.html
When loaded in a browser:
Previous: CWL version support Next: Analyzing workflow cost (cloud only)